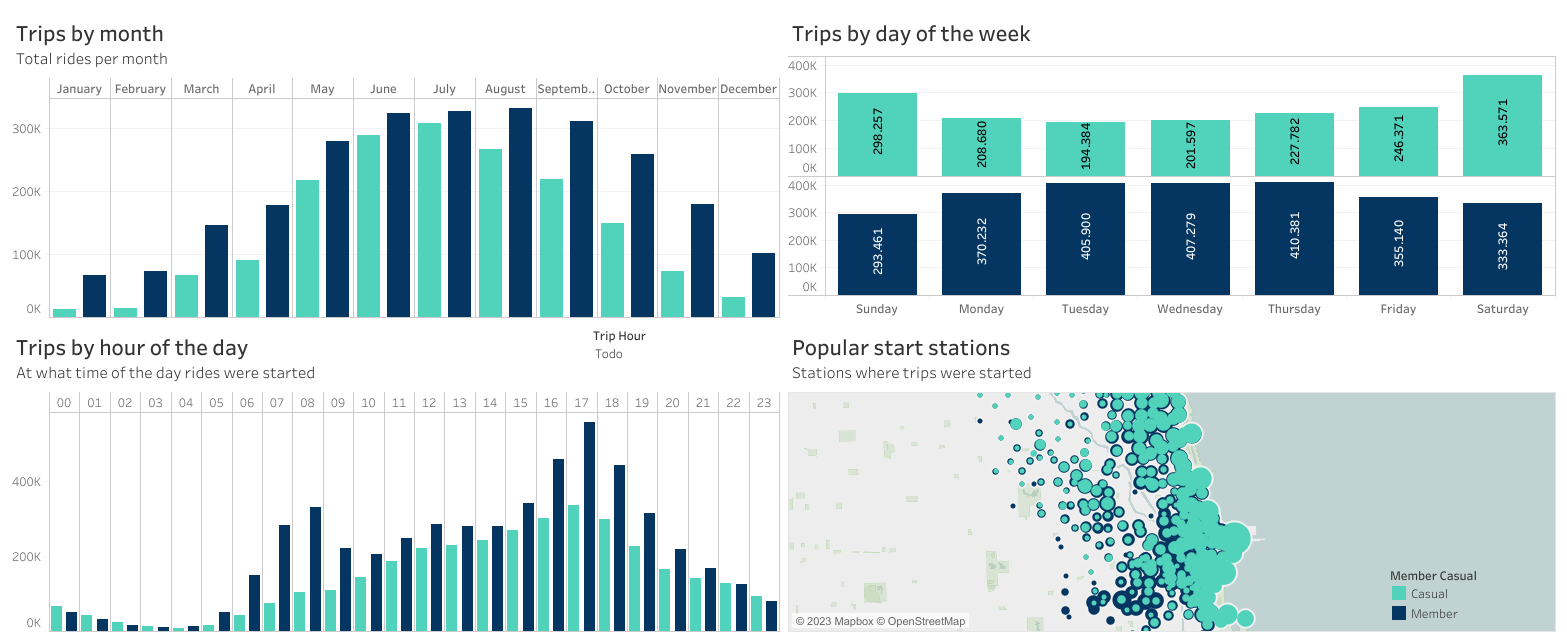
Insights for bike rides in Chicago
Cleaned, analyzed and visualized a dataset containing daily trips of year 2022 from a bike rental service using Excel, BigQuery and Tableau.
Cleaned, analyzed and visualized a dataset containing daily trips of year 2022 from a bike rental service using Excel, BigQuery and Tableau.
Explored data from 2020-2023 covid cases, deaths and vaccines in Mexico using SQL Server and Excel and visualized the data using Tableau.
Python program that retrieves any table contained in a Wikipedia page and allows the user to save one or all tables in a .csv format using the pandas library.
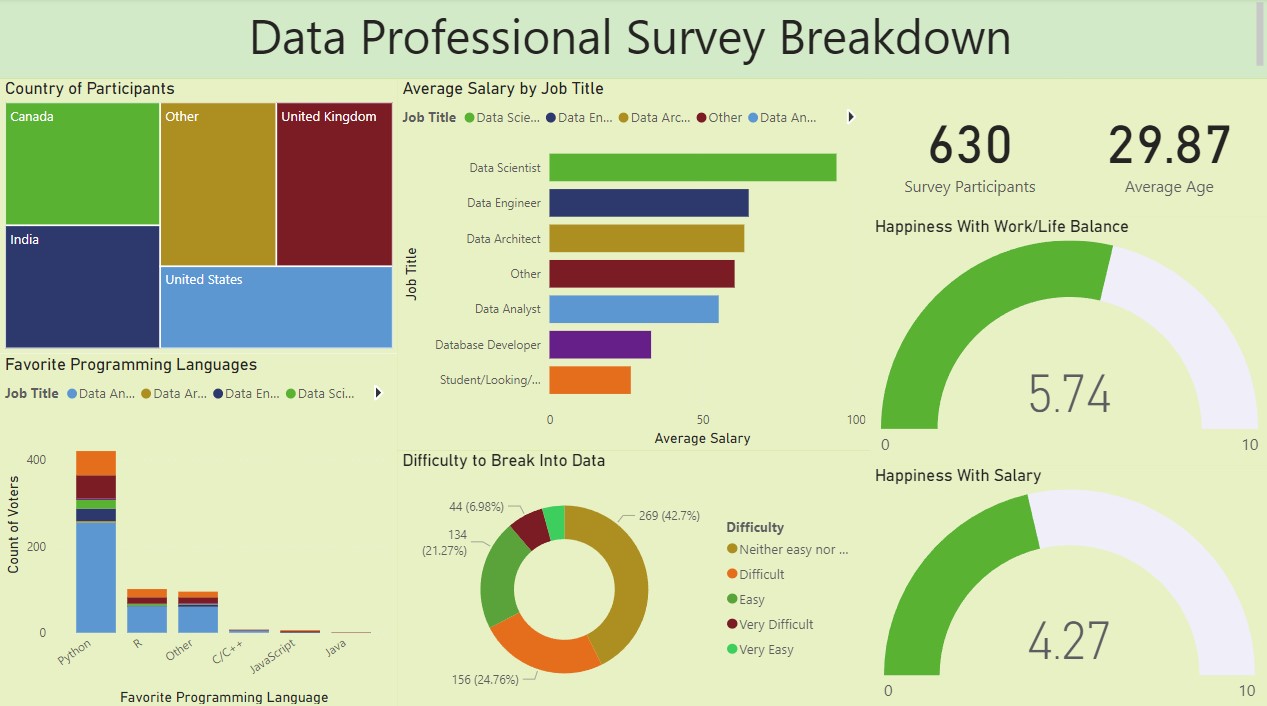
Power BI Dashboard to analyze and present a breakdown using data collected from surveying data professionals about many aspects of their data related jobs.